Data from the 2019-2020 National Agricultural Workers Survey
Last updated: September 2022
Click here to download the fact sheet as a PDF file.
INTRODUCTION
This fact sheet presents key statistics on the health of migratory and seasonal agricultural workers from data collected primarily from 2,172 agricultural workers by the U.S. Department of Labor’s National Agricultural Workers Survey (NAWS) between October 1, 2018, and September 30, 2020 (most recent available data). [1] The NAWS provides information about the employment, demographic, and health characteristics of crop workers, and workers engaged in support activities for crop production. Health data covers health history, occupational health, and access to health care.
LIMITATIONS
The NAWS is a valuable source of information but has several limitations. The NAWS includes workers on farms, orchards, greenhouses, and nurseries, but it does not include workers employed in animal production, dairies, or aquaculture. The NAWS covers a variety of farm jobs, including some supervisory positions. The NAWS includes farmworkers regardless of immigration status but excludes H-2A guest workers (farmworkers from other countries in the U.S. on temporary work visas). [2] The NAWS interviews farmworkers in their workplaces rather than their homes. The interviewed farmworkers work for employers who consent to data collection by NAWS staff potentially leading to selection bias.
GENERAL DEMOGRAPHICS
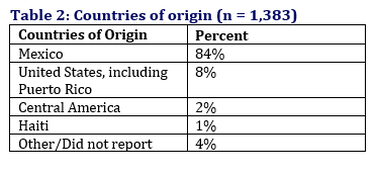
- Place of Birth: Approximately six out of 10 farmworkers were born in Mexico (63%); 30% were born in the United States or Puerto Rico.
- Ethnicity and Race: Seventy-eight percent of farmworkers identified as Hispanic. Among U.S. born farmworkers, 32% self-identified as Hispanic. Ten percent self-identified as Indigenous. [3]
- Gender: Sixty-six percent of NAWS respondents were male.
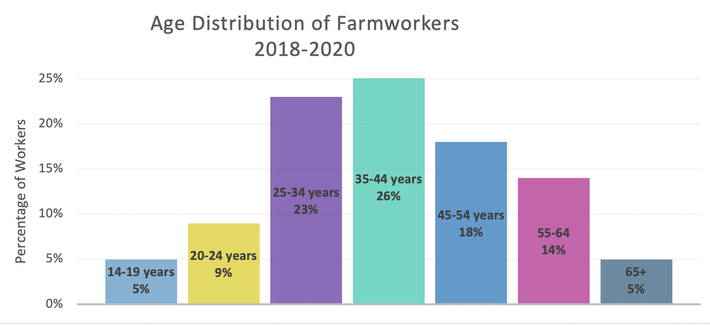
- Age: The average age of farmworkers was 41 years, with 67% between ages 25 and 54 years. See Figure 1.
- Marital Status and Dependents: Fifty-seven percent of farmworkers were married and 50% were parents.
- Primary Language: Spanish and English were the primary languages of interviewed agricultural farmworkers. Two-thirds (62%) of the interviewed farmworkers preferred Spanish as their speaking language and 25% preferred English. One percent of farmworkers preferred an Indigenous language.
- Migratory Workers: Fifteen percent of respondents were migratory as opposed to 85% reported as settled farmworkers. [4] Of those migratory farmworkers, nearly half were domestic (46%), 48% were international, and 6% had been in the U.S. less than a year.
Figure 1: Age Distribution of Agricultural Workers, 2018 -2020
EMPLOYMENT AND HOUSING
- Housing: Thirty percent of farmworkers responded they lived in a “crowded” dwelling, using the U.S. Census Bureau, Census of Housing definition of overcrowding. [5] Sixteen percent of respondents lived in employer-provided housing while 53% rented, 31% owned their home or lived in a relative’s owned home, and 1% lived in government housing. Out of the 2,172 farmworkers surveyed, 99 expressed that they themselves pay for housing, while 274 receive free housing from their employer. Thirty agricultural farmworkers reported having housing paid for by the government, charity, or another organization.
- Work type: Eighty-two percent of respondents worked in fruits and nuts (38%), vegetables (20%), and horticultural crops (24%), 14% worked in field crops, and 3% in mixed crops or other crops. Eighty-eight percent of respondents were directly hired farmworkers and 12% were contracted laborers.
- Wages, Income, and assets: From 2019-2020, 50% of agricultural farmworkers reported an annual total family income of less than $30,000, and 20% had family incomes below the poverty level in the previous year. Migratory agricultural farmworker families were most likely to live in poverty with 44% reporting incomes below poverty level from 2019-2020 compared to 16% of settled Agricultural farmworkers. The average hourly income reported was $13.59. [6]
- Working hours: Forty-two percent of farmworkers reported working more than eight hours a day. See Figure 2 below.
Figure 2: Percentage of Workers by Daily Work Hours, 2013-2020
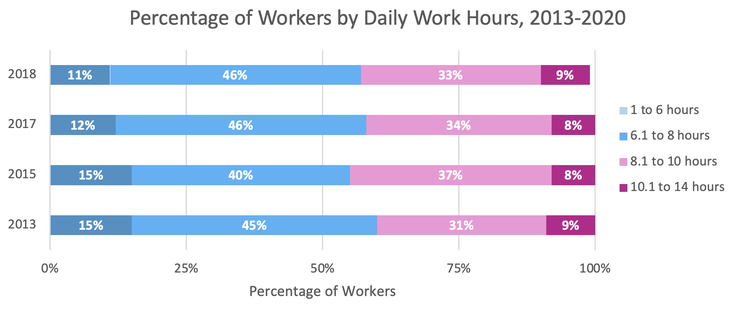
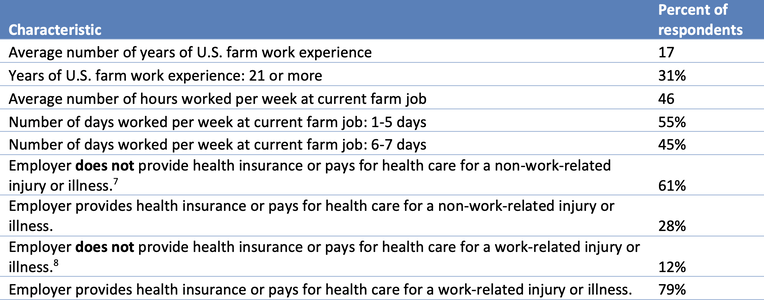
Table 1 provides data about employment statistics of agricultural farmworkers.
Table 1: Employment Statistics of Ag Farmworkers, 2019-2020
NEED-BASED PROGRAM UTILIZATION
Table 2 illustrates the percentage of farmworkers who claimed a person in their household received assistance from need-based programs:
Table 2: Utilization of Need-Based Programs, 2019-2020
- Workers’ compensation coverage: Seventy-nine percent of the 2019-2020 NAWS respondents reported that if they were injured at work or got sick as a result of work, their employer provided workers’ compensation, 10% reported that did not have workers’ compensation, and 13% did not know their coverage status.
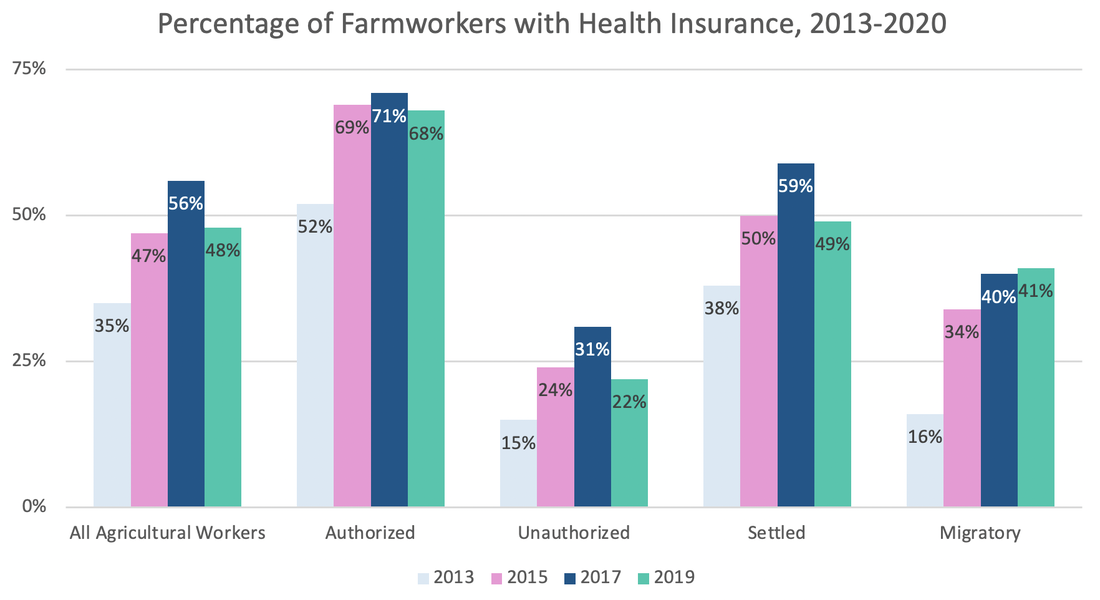
- Insurance coverage: Forty-eight percent of NAWS respondents had health insurance. Of those farmworkers with health insurance, 26% said their employer provided the insurance, 39% had insurance through a government program, 13% reported they or their spouse paid for the insurance, 7% were covered under their spouse’s plan, 12% were covered by another family member, and 7% reported another entity paid for their insurance. [9] Ninety-one percent of respondents reported that their minor children had health insurance.
- Insurance coverage across worker status: Insurance coverage among all farmworker groups had been increasing over the last decade, however majority of groups experienced a decrease in insurance coverage from 2017-2018 to 2019-2020. Migratory farmworkers were the only group that a larger proportion of farmworkers covered by insurance in 2019-2020 than 2017-2018. See Figure 3.
Figure 3: Percentage of Agricultural Workers with Health Insurance, 2013-2020
Disclaimer: This publication was supported by the Health Resources and Services Administration (HRSA) of the U.S. Department of Health and Human Services (HHS) as part of an award totaling $1,742,242.00 with 0 percentage financed with nongovernmental sources. The contents are those of the author(s) and do not necessarily represent the official views of, nor an endorsement, by HRSA, HHS or the U.S. Government.
1. This analysis utilizes the National Agricultural Workers Survey public access data from fiscal years 2011-2020. The data can be retrieved from https://www.dol.gov/agencies/eta/national-agricultural-workers-survey . All percentages have been rounded to the nearest whole number, except for percentages below 1%. Only results equal to or greater than 1% were reported.
2. See NCFH H-2A fact sheet for more demographic and other data on H-2A agricultural workers: http://www.ncfh.org/h-2a-guest-workers-fact-sheet.html
3. NAWS supplements the question on primary language used with questions that ask about all adult languages spoken as well as childhood language exposure. The NAWS uses a combination of the responses to these questions and the question about race to identify agricultural workers who are indigenous.
4. The term “migratory” is defined by NAWS as a worker reporting agricultural jobs more than 75 miles apart or reported relocating more than 75 miles to work in agriculture.
5. The definition of an overcrowded household follows the U.S. Census definition which is a ratio of greater than one for the ratio of persons per room (excluding bathrooms and garages). https://www.census.gov/data/tables/time-series/dec/coh-crowding.html
6. Piece rate and combination wages were converted to an hourly wage, then averaged with the wages of workers who were paid by the hour.
7. 11% do not know if they are covered.
8. 9% do not know if they are covered.
9. Percentages sum to over 100% because respondents could select all that apply